

Breakthrough technology introduced by the Stanford University is the basis of Tableau desktop. Drag and drop option is used in the breakthrough technology to analyze data in few clicks you can connect to data. Then you can visualize and create interactive dashboard with few more.
Tableau desktop can be used easily. Those who are comfortable with excel can learn it easily by using tableau desktop more result can be achieved with less effort. Tableau desktop is 10-100x faster that the existing solutions.Years of research has taken place to build a system which supports natural ability of people to think usually.
Strengths of Tableau
- Ease to Use
You can see every change once it is made with intuitive and drag & drop feature of tableau desktop. Without taking your eyes out of the data, tableau desktop works at the speed of thought. Those who are familiar with excel can quickly get up to speed of tableau. To see and understand many facets of business at the glance, it is used by business leaders. The benefits for the marketers are to make data driven decision that drive ROI through the roof.
- 10 - 100x Faster
It will help you to make with massive data. Tableau data engine is really fast. You don’t have to use anything less that all the data you need, with tableau desktop. The meaning of architecture – aware approach of tableau is that, you can bring all the data onto the laptop and still have interactive response time.
You can work with millions of rows of data on your own computer and get result in seconds. It provides real-time business analytics for real-time business data. As well as, can publish to tableau server and collaborate with colleagues. They can work at high speeds by using the data sources, you have shared.
- Smart, fit and beautiful dashboards
Multiple views of data can be combined into a single dashboard. Web pages, images and documents are inserted for better storytelling & faster insight. It also highlights and filters related data. Dashboard can be connected to live data just like your views. As an alternative you can use the built-in data engine to speed up your analysis.
You can share brilliant dashboards that you have created in Tableau or you can keep them to yourself without sharing. Tableau is data visualization software that takes your Analytic to the next level.
- Analytic on the iPad, Android tablets, SharePoint and everywhere
Interactive dashboard can be published to the web in seconds by using tableau server. Then dashboards can be embedded in SharePoint site or they can be viewed on an iPad or android tablet. As the viewer’s only need a web browser or a tablet to filter, sort and answer their questions. They can engage anywhere, anytime, and then at least data analysis moves out of the back office and in to core of your business.
Publishing takes only few clicks. To show up on web browsers, mobile safari or tableau mobile app. You can don’t have to make changes to your dashboards.
- Direct connections
Tableau eliminates building elaborates “universes”, “cubes”, and temporarily tables by the user before any real work can be done. Pulling data into database is not a requirement. You work directly from your database. You can manage your own data connection and Meta data, so that your work will never have any impact on the production database.
In Tableau you can connect directly to databases, cubes, data warehouses, files and spreadsheets in tableau. Can see up-to-the-minute data as you have live connection, it takes just a few clicks and no programming is needed. You’ll be accessing data, consolidating numbers, and visualizing results without advance set-up. It's true ad-hoc business analytic.

- Best practices in a box.
Important benefits of tableau desktop are that providing best ways of data representation, having carefully optimized color schemes that tell clear stories, option of built-in worldwide mapping and having an elegant design that keeps users focused on what’s important.
Providing data visualization software that helps you to understand and communicate into the most effective way possible is the main goal.

Weaknesses of Tableau
- Lack of controls
Doesn't have any controls such as dials and gauges which are generally associated with dashboard software
- Doesn't handle hierarchical data well
this can cause problems when filtering as it doesn't recognize the hierarchy making filtering close to unworkable for the users and the fact it’s not possible to ‘clear all’ filters enabling the user to start again when using complex filters
Architecture
Highly scalable & n-tier client server architecture of Tableau provides mobile clients, web clients and desktop installed software. As the authoring and publishing tool, Tableau desktop is used to create shared views on Tableau server.

Tableau server can be scaled up to hundreds of thousands of users. It is an enterprise- class business analytic s platform. It works with a company’s existing data strategy and security protocols. Tableau server provides powerful mobile and browser based analytic s.
Features of Tableau Server:
• Multi-threaded
• Multi-process enabled
• Provides integrated clustering
• High Availability
• Secure
• Runs on both physical and Virtual Machines

Data Layer
Tableau enables user’s choice of data architecture. Storing data in any single system or proprietary is not required in tableau.it can work with databases, cubes, or excel files at the same time. Therefore it is useful regarding organization with varied data environment.
Bringing all the data in-memory unless the user has chosen them is not required. Tableau allows the users to force the investment by utilizing the power of the database to answer the questions. If the existing data are fast and scalable or else fast in-memory data engine in tableau server easy option to upgrade the database to be fast & responsive.
Data Connectors
Tableau consists no of optimized data connectors for database. Such as Ms Excel, SQL Server, Oracle, Teradata, Vertica, cloudier hadoop. A generic ODBC connector is there in any system without native connector. Live connection and in memory are the two models of tableau which fulfil the purpose of interacting with data. Depending on the user’s choice, it is possible to switch between live and a in memory connectors.
Live connection:-
Rather than importing all the data, data connectors of tableau empower the existing data infrastructure by sending dynamic SQL or MDX statement directly to the source database. By using a fast, analytic-optimized database like Vertica, you can gain benefit by connecting live to user’s data.
As a result, the details data in the source system is left and aggregated result of tableau is sent to queries of tableau. This shows the tableau’s capability of utilizing unlimited amount of data effectively. Tableau acts as the front end analytics client to many of the largest database worldwide. Each connector is optimized by tableau in order to get the benefit out of unique features of each data source.
In-memory:-
Tableau is fast in memory data engine is optimized for analytics with one click the user can connect to the data and extract the data to bring it in memory of tableau. The entire system is fully utilized by tableau’s data engine to obtain fast query response on millions of data rows on commodity hardware. It is not bounded by the size of the memory on a system. So that Data engine can access disk storage and also the RAM and cache memory.
Tableau Server Components
Tableau Server is handled the following four server processes:
Application Server:
Browsing and permissions for the Tableau Server web and mobile interface is handled by the Application server process (wgserver.exe). User starts a session on tableau server by opening a view in a client device. This implies that an application server thread is start and checks the permission of that user and view.
VizQL Server:
The client sends a request to the VizQL process (vizqlserver.exe) when the view is opened. Then the VizQL process sends queries directly to the data source. Then it returns a result set which is rendered to image and it is presented to the user. There is a cache for the each VizQL server which can be shared across multiple users.
Data Server:
By using tableau data server, Data sources of tableau can be stored and manage centrally. Metadata including calculations, definition and groups are also maintained from tableau desktop. Published data sources are based on the tableau data engine extract or live connection to a relation database.
Backgrounder:
This refreshes schedule, extract and manage other background tasks.
Gateway / Load Balancer
There is a primary tableau server called Gateway. It sends requests to other components. The request comes from the client; first hit the gateway server and routs to suitable process. Gateway acts as a load balancer who distributes requests to the process when multiple processes are configured for any component. All processes waits at gateway or primary server in a single server configuration. There are two types of servers when considering a distributed environment.one physical machine is designated at the primary server and the others are designated as worker servers which run any number of other processes. More frequently only one machine is used as the primary server in tableau server.
Web Browsers, Mobile Apps Tableau Desktop
Interactive dashboards are provided to users by tableau server. These dashboards are provided to users by tableau server. These dashboards are provided via HTML and JavaScript (AJAX) in a web browser or natively via a mobile app. plug-ins or helper applications are not required.
Tableau Server supports:
• Web browsers: Internet Explorer, Firefox, Chrome and Safari
• Mobile Safari: Touch-optimized views are automatically served on mobile Safari
• IPad app: Native iPad application that provides touch-optimized views and content browsing
• Android app: Native Android application that provides touch-optimized views and content browsing
• Android browser: Touch-optimized views are automatically offered in the Android browser
Creating and publishing views, reports and dashboards to tableau server is done rapidly in tableau desktop. A report author can connect to multiple data sources, explore relationships, create dashboards, modify metadata, using tableau desktop. And finally a completed workbook or data sources can be published to tableau. Any workbook published on tableau server can be opened using tableau desktop. Whether published as an extract or a live connection tableau desktop can connect to any published data sources.
Comparison between Tableau and other Business Intelligent tools
- Business perspective
Criteria
|
Tableau
|
MS BI
Stack
|
Spotfire
|
Qlikview
|
Implementation Speed
|
Good
|
Average
|
Good
|
High
|
Scalability
|
Very Good
|
Good
|
Unlimited
|
Limited by RAM
|
Pricing
|
Average
|
High
|
High
|
Above Average
|
Licensing/support cost
|
High
|
Average
|
High
|
High
|
Long-term viability
|
Average
|
Excellent
|
Good
|
Excellen
|
- Technical perspective
Criteria
|
Tableau
|
MS BI
Stack
|
Spotfire
|
Qlikview
|
Interactive Visualization
|
Very Good
|
Good as
Excel
|
Very Good
|
Excellent
|
Data Integration
|
Excellent
|
Good
|
Good
|
Good
|
Visual Drill-Down
|
Good
|
Average
|
Very Good
|
Excellent
|
Dashboard Support
|
Good
|
Below
Average
|
Very Good
|
Excellent
|
Integration with GIS
|
Good
|
Average
|
Excellent
|
Excellent
|
Modeling and Analytics
|
Excellent
|
Good with
SSAS
|
Excellent
|
Weak
|
UI & set of Visual Controls
|
Very Good
|
Good
|
Very Good
|
Best
|
Overall Summary
|
Visual OLAP
|
Backend for DV
|
Visual Analytics
|
DV, Drilldown
|
Installation
Double click on the downloaded Tableau desktop setup and will display given below wizard.

Then display the Welcome to Tableau page and accept license agreement and click on the Install button. If you want you can view the Licence Agreement by clicking the “View Licence Agreement”

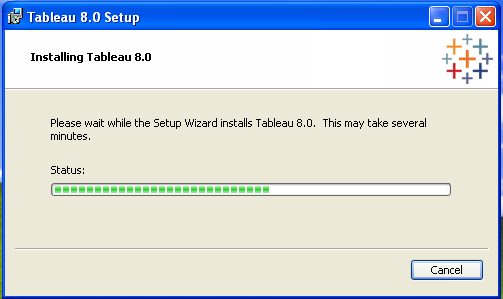
After appears the installing wizard and it will depend on your computer performance.
After completing the above wizard, appears the Tableau activated page. If you have product key, by clicking activated button, you can install licence version of the tableau desktop. In this case, supposed to install train version and it will expire in 14 days. To install trail version click on the “Continue Trail “button.

As the final step, Tableau desktop interface will be displays as below.

Above installed version is Version 8.0 Tableau Desktop Professional Edition and refer the given below screen shot.
Tableau 8 Desktop (Business Intelligence Tool)
 Reviewed by Pubudu Dewagama
on
8:56:00 PM
Rating:
Reviewed by Pubudu Dewagama
on
8:56:00 PM
Rating:
Reviewed by Pubudu Dewagama
on
8:56:00 PM
Rating:


ReplyDeleteNice and good article. It is very useful for me to learn and understand easily. Thanks for sharing your valuable information and time. Please keep updating
Tableau Online Training
Tableau Training
Tableau support
Thanks for sharing valuable information very well explained.
ReplyDeletetableau certification
tableau online course